For the last few years, UK productivity analysts including myself have been arguing that the OBR has been too optimistic with regards to its productivity forecasts. Hence the downgrade in the recent OBR report from 1.3% down to 1.0% per annum was unsurprising.
This downgrade negatively impacted the fiscal outlook which was exacerbated by the OBR’s statement (3.13) that “none of the policy measures in this Budget have a sufficiently material impact to justify adjusting our post-measures potential output forecast.” Hence the government raised taxes to provide greater fiscal headroom.
Other factors in the OBR’s updated outlook that are of concern include a deterioration in overall NGDP from 15.7% to 14.8% over the period (Table 2.1) with a boost to labour income but a substantial hit to corporate profits. Meanwhile, its forecasts for inflation from 2027 at 2% (Table A.1) look overly optimistic given that the UK has become a more closed economy since 2016: closed economies are inherently more inflationary. Higher than expected inflation of say half a percentage point each year from 2027 will increase government spending commitments while eroding household incomes and dampening growth.
Crucially, the OBR notes that if productivity growth continues at its current rate of 0.5% pa the current budget would be in deficit by 2029-30 of £6bn compared to the expected surplus of £22bn based on its 1.0% forecast. In essence how the productivity forecast turns out matters for the fiscal outlook. A more likely outcome for productivity growth is for it to range between 0.5% – 0.7% by the end of the horizon, which will have a substantial impact on the fiscal outlook.
The new productivity forecast
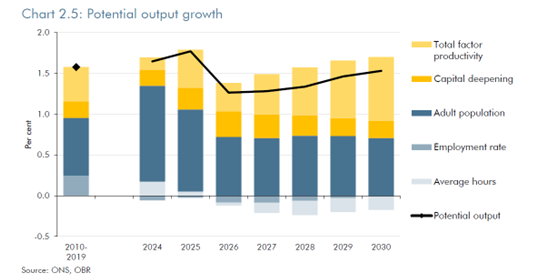
The OBR forecasts total factor productivity (TFP) growth as 0.8 % combined with 0.2% of capital deepening thereby contributing to a 1% pa in labour productivity growth in its medium term forecast as shown in the OBR’s Chart 2.5.
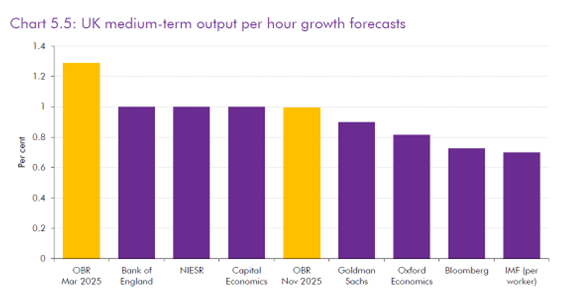
However, the OBR’s forecast is at the top of the forecasters range along with the Bank of England, while Bloomberg comes in at 0.7% as in the OBR’s Chart 5.5.
Before I go into why I think the OBR’s forecast is overly optimistic it is worth going through the OBR’s methodology which is set out in its excellent briefing paper on forecasting productivity. It’s important to note upfront that trying to forecast productivity growth is not only a challenging task, and the different approaches can generate wildly different outcomes.
The OBR starts its process using a time series approach taking into account two different methods including a random walk and a trend stationary model. The random walk approach in my view is more credible as it assumes growth fluctuates around a rate with no mean reversion to a pre-shock rate, whereas the trend stationary or general model permits a mean reversion to the pre-shock level. The random walk approach generates a lower baseline forecast than the general model used by the OBR by roughly 0.2 percentage points which is the first reason why their forecast is optimistic.
The structure of the underlying economy is constantly changing as it reacts to the world around it. Hence the notion that there is some unchanging rate at which an economy should grow, and always reverts to, mis-characterises the dynamics of advanced economies competing in the global market place.
The idea of changing economic structures is now prevalent in financial economics following the work of James Hamilton on regime changes. For example, understanding the way in which stock markets behave is not a constant throughout history but relevant to the changing conditions of an economy. US profits in the last 10 years have been significantly higher than at any time since 1980, hence it is unsurprising the stock market has outperformed in the most recent period.
The OBR rightly points out that such an approach does not take into account future technological breakthroughs such as from AI, as well as other structural drivers of growth including the transition to net zero and trade intensity.
The OBR’s forecast of an extra 0.2 percentage points of growth as a result of firms applying AI is not unreasonable, however, the timing of this is inherently uncertain and is unlikely to impact within the forecast horizon. For this to happen firms need to have figured out how to use the new technology to offer new products and services which this Economist article is negative about. Indeed it took about 25 years for the computer revolution to show up in the productivity figures. Hence the 0.2% boost by the end of the forecast horizon seems highly uncertain and is the second reason why the forecast is overly optimistic – by perhaps 0.1 percentage points.
Conversely trade intensity, which tends to improve the competitiveness of firms, is likely to fall thereby dampening productivity growth. Furthermore, the OBR expects the transition to net zero to pose a downside risk to productivity due to the disruption associated with phasing out carbon-intensive industries. Indeed, the decline of North Sea oil and gas production has been negatively contributing to growth for some years now. Hence this is the third reason to be negative about the forecast although the OBR did consider these two factors as contributing negatively.
The final component for a productivity forecast is to understand the sectoral dynamics given that sectoral performance is not constant through time. Indeed, the evidence is quite strong that only a handful of sectors are responsible for driving productivity growth.
The OBR provides a useful assessment on the contributions of each sector through time in its Chart 4.7 which highlights the fall in contribution from ICT, Manufacturing and Finance from the period prior to 2007 to more recent periods. It also shows what is known as the Composition effect which looks at the reallocation of labour between sectors. Hence prior to 2007 there was a negative composition effect which means that labour was moving from high to low value-added sectors which was also the case from 2010-19. However the net figure doesn’t provide any detail on which sectors are losing and gaining labour share.

An alternative approach is to use a Generalized Exactly Additive Decomposition based on Tang & Wang (2004) which provides the composition or Between Effect for each sector. This provides greater insight into what is happening at the sector level in terms of changes in labour reallocation and relative prices, although as with any sectoral decomposition methodology there is no perfect approach as noted here by Diane Coyle.
In my most recent sectoral decomposition for the Bennett School for Public Policy the decomposition highlights some important insights related to the OBR’s breakdown since 2020.
It shows that while the Within Effect of Manufacturing was indeed positive it has suffered from a large negative Between Effect which means that its contribution to growth was negative and large.
With regards to the Public Sector, while its Within Effect has been close to -1.0% over the period, it has experienced a large increase in the Between Effect driven by the expansion of the civil service.
However, the most important takeaway from the data is that private sector productivity growth has been stagnant since 2019. If that’s the case any random walk time series modelling would result in an even much lower base forecast of perhaps another 0.1 percentage point.
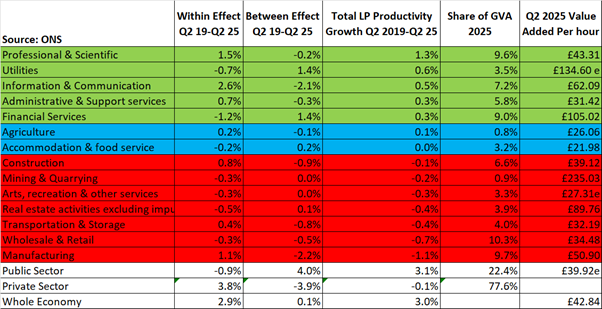
As noted above what matters for growth are the performance of high value-added sectors which account for about a third of the private sector economy including Manufacturing, Mining & Quarrying, Information & Communication and Financial services. But 40% of the high value-added sectors (Manufacturing and Mining & Quarrying) have been contributing negatively to productivity growth. Furthermore, the public sector will start to generate a negative Between Effect as the civil service is now expected to cut headcount by 8% with labour likely moving to lower value-added services roles.
Given the above building blocks the 1% labour productivity growth appears to be an overly optimistic scenario with the OBR’s downside scenario of 0.5% seeming quite plausible due to:
- Lower baseline forecast using random walk due to the lack of mean reversion
- Timing of the AI boost to productivity likely to be too aggressive.
- The trend towards net zero and reduced trade intensity
- Stagnant private sector productivity growth with a negative contribution from Mining & Quarrying and Manufacturing, and an expected negative “Between Effect” contribution from the Public Sector.
Other government policies for increasing growth
What about other government policies that were announced prior to this budget including the increase in public investment announced by the Chancellor in October 2024 and March 2025 of an additional £125bn over this parliament? One of the challenges in the returns to public investment is that they take a long time coming. The OBR in their October 2024 outlook modelled the impact of public investment as per chart 3.4.
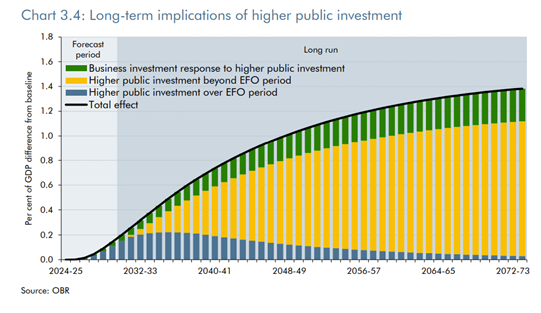
Despite this increase, the returns to the economy are some way off with only an initial 0.14 per cent of GDP added to potential output by the end of the forecast horizon in 2029-30 which tripled to 0.43 per cent after 10 years. But it is also a category error to assume that more public investment equals faster productivity growth. To paraphrase Morrissey Some Public Investments are better than other Public Investments. As Bertie Ohlin famously wrote in his critique of Keynes’ General Theory “thus the multiplicatory effect may easily at one time be ten and at another time considerably less than one.”
Moreover this £125bn of additional public investment is set across multiple regions and types of investment including infrastructure, green energy, defence, healthcare, and technology. The infrastructure deficit alone is over £700bn.
Finally, it is worth noting that the OBR has not yet provided any comment on the extent to which the government’s industrial strategy might boost productivity growth. This is likely to have been a blow for the Government given the priority it has put on it, which may have been because the effects were under the threshold of 0.1% of GDP. The following measures announced in the budget should have some impact on boosting growth including:
- Eliminating stamp duty from trading for all IPOs for three years post IPO (3.83)
- Knowledge intensive companies will be able to raise money under EIS and from VCTs for longer: to a max of £40m. (4.41)
Potential positive policy responses that could boost growth by the forecast horizon
As it currently stands the OBR’s productivity forecast of reaching 1% pa by the end of the forecast period is unrealistic. Somewhere between 0.5-0.7% per annum is a more likely outcome given the various structural issues facing the country. This will place further pressure on gilt yields forcing the Chancellor to either raise taxes again or cut spending.
That said, there are two policy areas that could drive up growth within the forecast period including:
- a focus on boosting infrastructure and housing in high value-added agglomerations whose growth is constrained such as across the Oxford to Cambridge arc and the Bristol to Cheltenham arc.
- The development of industry-led subsector implementation plans with a focus on increasing GVA and jobs at a 2, 5 and 10 year time horizon.
First, enabling high value-added firms to expand faster if they have access to deeper labour markets is the most predictable way to boost productivity growth. To achieve this would require new transport systems to be delivered opening up large scale high-density, good-quality housing for more knowledge workers. This infrastructure could be self-funded by public corporations and delivered more quickly due to superior governance arrangements signalling to firms in those locations to increase their investments. However, the government has not chosen to go down this path with HMT pushing its PPP framework while maintaining control of all public investment via gilt financing. This in turn has placed far greater pressure on the public finances and resulted in poor delivery. Furthermore, this restricts the size of investments meaning that the desperately needed transport systems are not prioritised, and hence growth is persistently restricted. This option is still open to the government if it is serious about growth.
Second, the Industrial Strategy as it currently stands is unlikely to result in much faster growth. Productivity growth takes place in high value-added firms across the country not in Whitehall – but the published Sector Plans are a list of government actions. The best practice approach from West Germany, Taiwan and Singapore is for industry-led plans to be developed with government support at a subsector level. Hence, the government could boost growth if it developed subsector implementation plans with GVA targets at 2, 5 and 10 year horizons. Here is an example of one in the UK for the Med Tech Sector. This option is still open to the government if it is serious about growth.
While the productivity forecast is currently overly optimistic, the government still has the option to boost growth should it choose to. Politics is about choices after all.