The variability of emerging market performance implies that asset allocation be best approached from a country perspective. An analysis of the ex post Wicksellian Differentials and ex ante signals of BRIC countries highlights continuing diverging trends with the destruction of capital having been a major challenge for investors.
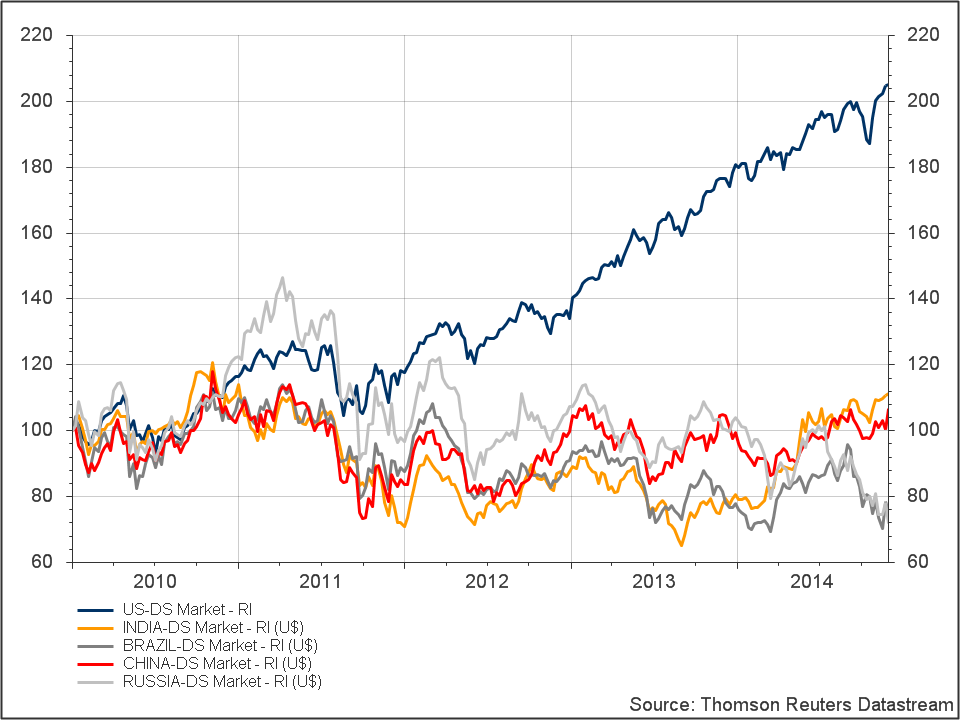
Emerging market equities have performed poorly over the last four years. Brazil and Russia have fallen by more than 20% with the Chinese market roughly at the same level as four years ago. Only India has managed to buck the trend, with its 10% return over the period largely down to the recent surge in confidence related to the election of Prime Minister Modi. In contrast, equity returns in the US market have more than doubled.
Chart 1: Equity return indices in USD: USA, Brazil, Russia, India, China
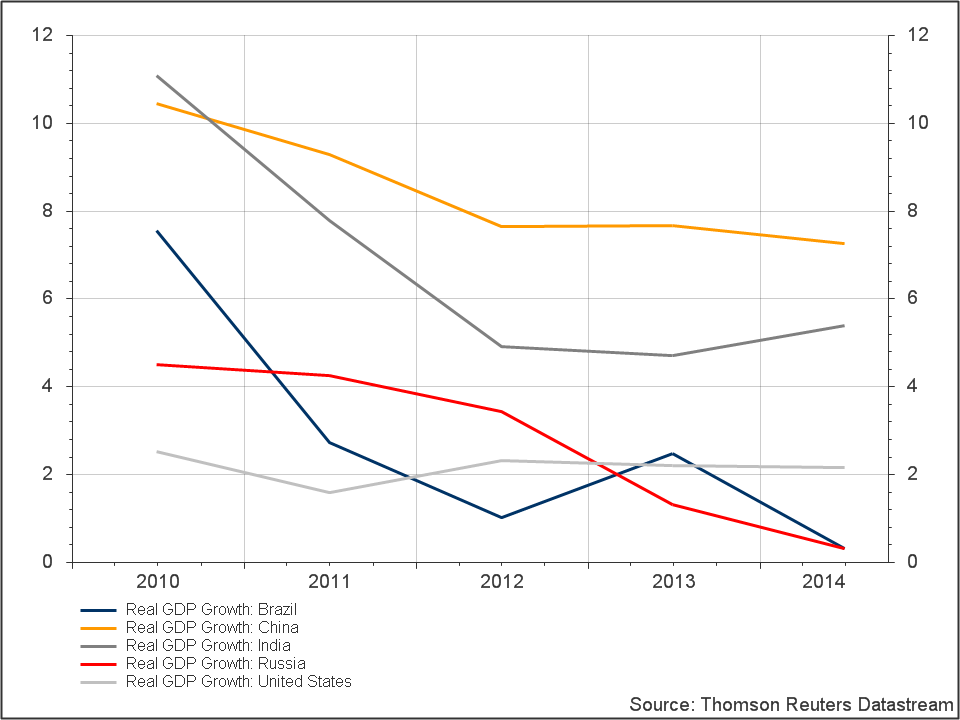
A comparison of GDP growth rates would not have provided much insight into this relative equity performance as shown in chart 2. Since 2010, China has averaged growth rates of over 8% with the United States hobbling along at the 2% level. Given that equity returns over the period were static in China and more than doubled in the United States, investors using GDP growth rates as an asset allocation tool would have been disappointed. However such a mismatch between GDP growth rates and equity returns should not be surprising given that long run econometric analyses of these two variables demonstrate little positive correlation.
Chart 2: GDP growth rates: USA, Brazil, Russia, India, China
In Profiting from Monetary Policy it was argued that investors need to discard the framework of general equilibrium models and focus on a credit disequilibrium process by analysing the difference between the return on capital and the cost of capital at the macro level. This relationship is known as the Wicksellian Differential after the Swedish economist Knut Wicksell, who developed the first pure credit model of an economy.
When the Wicksellian Differential is increasing, the outlook for equities is positive and when it is decreasing the outlook for equities is negative. Markets of course can decouple from underlying fundamentals as they did during the 1990s resulting in a falling Wicksellian Differential and rising equity returns. This decoupling or asset bubble eventually leads to substantial losses for investors and the destruction of capital when the market falls.
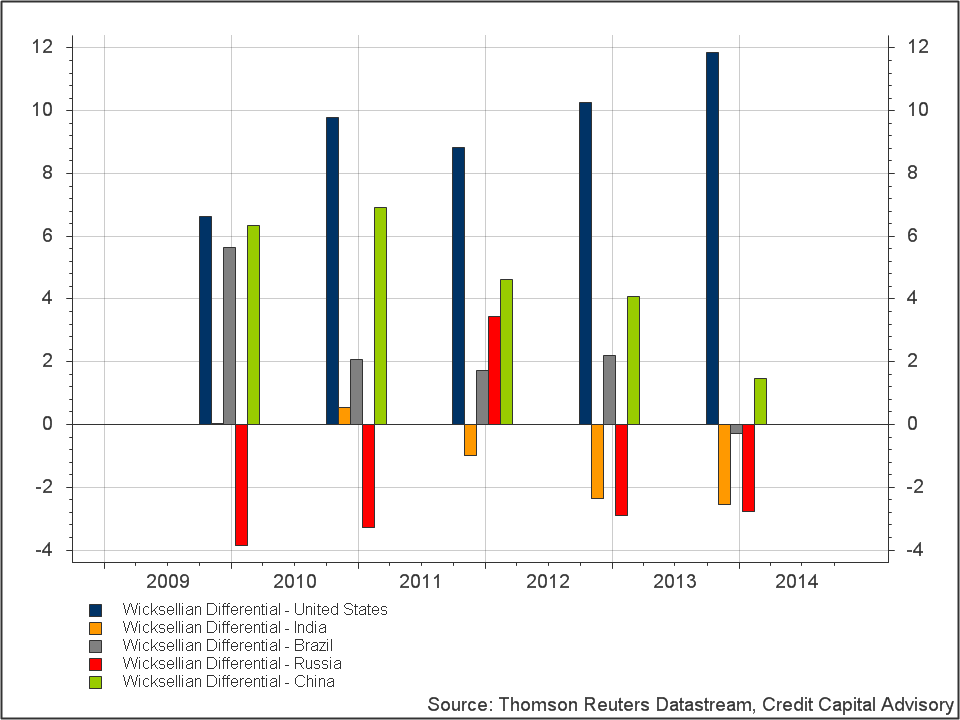
An analysis of the Wicksellian Differentials of the five countries demonstrates why the US has performed so well and why the BRIC countries have performed so poorly. The dark blue bars of the United States’ Wicksellian Differential in chart 3 demonstrate strong growth signals with the exception of 2011 when the level shrank coinciding with falling equity returns. China’s Wicksellian Differential, highlighted by the green bars has been in decline since 2010 corresponding to falling equity returns. However, the fact that China has maintained positive returns above the cost of capital has helped support equities on a relative basis. Russia, shown in the red bars has been plagued by bouts of capital destruction where the returns on capital are lower than the cost of capital. This accelerated in 2012 and 2013 causing the market to fall substantially. Brazil’s Wicksellian Differential in the grey bars also turned negative in 2013 accelerating the downward trajectory of equity returns. Finally, India in the orange bars has also demonstrated periods of capital destruction between 2011 and 2013 which is why until recently Indian equities performed so poorly.
Chart 3: Wicksellian Differential: USA, Brazil, Russia, India, China
In September, it was noted that the ex-ante credit signal turned negative for the US market. However due to the relatively low level of the cumulative credit index, the US market is unlikely to experience similar downturns to those that hit in 2001 and 2008. Hence there remain opportunities to invest in other equity markets given the lower expected correlation effect.
Estimates of the ex ante Wicksellian Differential gleaned by monitoring a stream of leverage ratios, trended near-term natural rates of interest by sector and a handful of macroeconomic indicators, can provide a great deal of insight into the ex ante level and hence equity returns. An analysis of the ex ante indicators for all BRIC countries highlights that India has the strongest signal. This is positive news for investors who have been convinced that Prime Minister Modi will be able to make a difference to the Indian economy. India’s financial services sector does however remain a worry with a negative outlook.
Table 1: Ex ante indicators by market
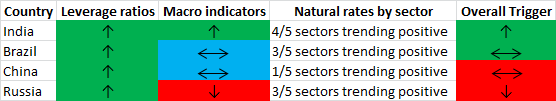
The outlook for Brazil, China and Russia remains less positive from a Wicksellian Differential perspective. In Brazil, the outlook for construction and finance remains negative, although Brazil’s ongoing struggle with higher than expected inflation should eventually benefit from falling oil prices. Although China’s financial services sector is generating a robust positive signal, excess capacity in other sectors implies a sluggish outlook for profits. Finally, the macroeconomic outlook for Russia remains clouded due to sanctions and falling oil prices. This comes on top of negative signals for business services and finance as well as a weak productivity outlook.
Distinguishing between countries when it comes to allocating assets remains core to successful investing. Just as equity returns differed dramatically across the Eurozone during the crisis, so can they vary significantly across Emerging Markets. An analysis of a country’s ex post Wicksellian Differential and its ex ante indicators can provide a great deal of insight into the direction of markets and help support asset allocation strategies.