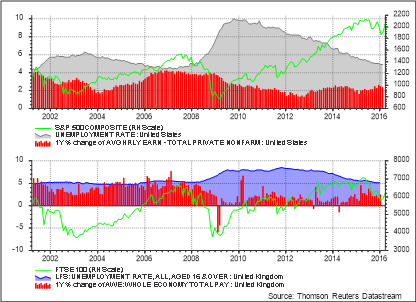
The jobs report announced on March 4, 2016 proved to be surprising for many. The S&P 500, which was introduced on that date in 1957, seemed unclear on how best to respond to it. The U.S. economy added an extra 242,000 jobs, with unemployment remaining at 4.9%. The U.S. is now close to its natural rate of unemployment of 4.8%, a proxy for full employment, although the labour force participation rate is at 62.9% compared with its peak in 2000 of 67.3%. The surprising statistic, though, was that despite the low level of unemployment, the rate of annualized nominal wage growth slipped to 2.2%, down from 2.5%.
Similarly low unemployment and wage growth figures can be observed in the U.K. with unemployment now at 5.1%. The difference in the U.K. is that its labour participation rate is at a record high of 74.1%. Many economists also argue that the U.K. is close to its natural rate of unemployment of around 5%. However, as in the U.S., the levels of wage growth remain muted at only 2.1%. Indeed, most of the boost to real earnings in the last two years has come from falling inflation rather than nominal wage growth.
A key challenge for the market remains to understand the relationship between unemployment and wage growth in relation to the current record low levels of interest rates and subdued inflation. Will wage inflation suddenly jump like it did in the 1970s when the Bee Gees were scaling the pop charts? Or is the economy going through some post-modern structural change where wage growth is unlikely to increase no matter what the level of unemployment?
Chart 1 Unemployment, wage growth & asset prices: US and UK
To whom it may concern
One challenge in trying to understand the dynamic of wage growth and unemployment are the different approaches one can take in analysing the problem at hand. Since the 1960s, a great deal of the analysis between unemployment and wage growth has been superseded by a more direct relationship between unemployment and inflation. However, such an approach has significant issues given that there can be little relationship between wage growth and price inflation, particularly during periods of large commodity price moves. Paul Krugman has strongly criticized the approach of analyzing the direct relationship between unemployment and inflation. Scott Sumner has also attacked this approach stating that, “whereas price inflation is a useless concept, wage inflation is a highly useful concept.”
A.W. Phillips, in his seminal 1958 paper, showed that there was a general relationship between wage growth (y-axis) and unemployment (x-axis). As unemployment falls, there is a tendency of wages to rise, with the slope determining the relationship between these two variables.
Chart 2: Phillips Curve United Kingdom 1873 – 2009
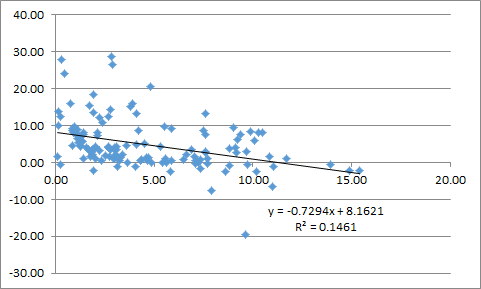
Source: Bank of England
This framework of thinking about the relationship between wages and unemployment was radically altered with the introduction of the vertical Phillips Curve by Friedman and Phelps. They identified what is now generally known as the natural rate of unemployment, which marks the point where the vertical Phillips Curve crosses the x-axis. This means that once the rate of unemployment falls below this level, it will by definition be inflationary and will not result in any longer term increase in output. Hence, there remain many inflation hawks that would like to see interest rates rise to ensure that the U.S. and U.K. economies don’t see a return to the inflation of the 1970s. On the other side of the argument, there remain economists who see little need to push up interest rates until wage inflation starts to hit the 3.5% level, given the central banks’ 2% inflation target and roughly 1.5% productivity growth.
Although the natural rate of unemployment is a moving target, the data generally show that there is a tendency for wages to grow as unemployment moves towards full employment. Indeed, according to the long term U.K. data, we should expect to see nominal wage growth of around 5% with current levels of unemployment. So what explains the current sluggishness of wage growth given low unemployment levels and high participation rates? In essence, why isn’t there much relationship between unemployment and wage growth as gleaned from Phillips’ original curve?
Horizontal
Phillips identified one such factor that might cause this relationship to break down — when import prices rise dramatically. He argued that rising import prices might have a significant impact on wage bargaining, driving up wages independently of the level of unemployment. Phillips also had a problem explaining the period 1879 – 1886, which showed a horizontal curve. As this didn’t fit his hypothesis, Phillips decided to use another data set which demonstrated a very gentle slope arguing “that some peculiarity may have occurred in the construction” of the index for those years. Whether this may or may not have been the case, this was occurring at a time of falling prices as the European and North American economies embarked upon a rapid period of industrialization.
In essence, it seems that the relationship between unemployment and wage growth is impacted by the level of exogenous prices. One way of thinking about this problem is to assess the level of trade openness of an economy – defined as imports and exports as a % of GDP. A more open country will be more sensitive to shifts in global prices, and crucially that country’s labor markets will also be impacted by the international division of labor.
Chart 3: Trade openness United Kingdom 1873 – 2009
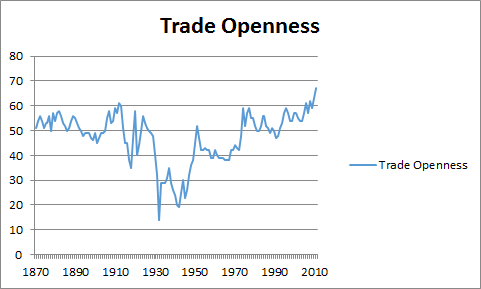
Source: International Historical Statistics
The data show that the period up to 1890 was marked by high levels of openness, which dipped below 50% in the mid-1890s before rising again just before the outbreak of WWI. The 1920s and 30s were marked by a steep decline in openness, with this beginning to reverse after WWII. Critically, the level of trade openness did not surpass the levels of the 1890 period until the 1990s.
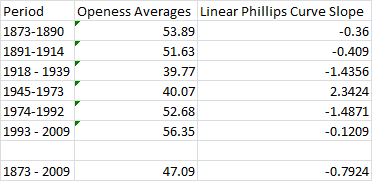
Table 1 shows the average level of trade openness across each time period, and also the slope of the regression which shows the relationship between wage growth and unemployment. The period between 1945-1973 demonstrates a positive relationship between wage growth and unemployment, i.e. wages rise as unemployment rises. This was due to the jump in nominal wages in the early 1970s and largely proves the idea of the vertical Phillips Curve. Besides this anomaly, the data demonstrate a general relationship between trade openness and the slope of the Phillips Curve: The higher the level of trade openness – the flatter the slope. The curve between 1993-2009 has a slope of only -0.1, with the more recent data showing a higher level of trade openness, suggesting that the curve may become even flatter.
Table 1: Trade Openness and Phillips Curve Slope
This relationship should not be surprising as numerous economists have argued for some time that a major driver of sluggish wage growth has been due to greater globalization, with sectors exposed to greater international competition explaining much of the fall. As less skilled workers are displaced by this process, they tend to gain new employment at lower wage levels. Such an analysis clearly explains the ongoing lack of wage growth in the U.K. and U.S. In order to maintain profit growth, firms will make decisions to increase labor in countries where their profits are not eroded by wage growth or alternatively decide to substitute capital for labor instead.
High Civilization?
Although the falling cost of imported goods does bring significant benefits to lower wage earners, the shift towards a more radical left and right politics implies that globalization is not working for many. Calls to pull back from increased trade openness however make little sense given that such a strategy will reduce the size of the pie to be redistributed between capital and labor. Globalization has played a major role in supporting asset prices, but investors should not assume that the current horizontal curve is here to stay.
As the Swedish economist Leijonhufvud argued, “the notion of a stable Phillips Curve is gone. Everybody’s Phillips Curve shifts and tilts and loops, now clockwise, now counterclockwise – and goes north by east when the gods are against you.” For now at least the Phillips Curve is flat, implying that market-driven wage growth is unlikely to drive up nominal wages and inflation. But the increasing frustration felt by many voters on how the rewards of globalization are being distributed may lead governments to intervene to increase the gradient of the slope, resulting in higher wages and lower profits. Investors should take note.
Great article Tom. Did you also study the relationship between part time jobs and wage inflation? A large part of the current low levels of unemployment are driven by an increase in part time roles (and various reports and study’s saying many of these are held by people who want either full time or more hours). As such the participation rates in the economy are not as high (if you weight employment based on degrees of full time work) as they were previously which also has a dampening effect on wage inflation.
Thanks Anthony. The data just isn’t there to run a long term study. I don’t think involuntary unemployment / underemployment will have much of an impact as this isn’t new throughout the last 140 years, but the “gig” economy may well be a response to globalisation. If it is then the horizontal-ish slope still holds.