The late economist Axel Leijonhufvud noted in a 1979 essay that the theory of the interest rate mechanism remains at the centre of the confusion in modern macroeconomics. All the inconclusive quarrels, he argued, largely stem from this source. While financial market academics continue to argue the merits of their preferred theory – whether it be IS/LM based models, Keynes’ liquidity preference or the loanable funds theory – bond traders have had to deal with the reality of conflicting interest rate signals.
The recent dramatic shift in the path of interest rates indicates fixed income markets have become, in the words of Fischer Black, “noisier” than usual – with 1 year interest rates soaring from 1% to 5% in just 12 months, as shown in Chart 1. This has of course been mostly driven by higher than expected inflation, with the Federal Reserve raising its target rate to increase the cost of credit across the economy. Longer term maturity bonds have risen from just over 2% to around 4%, increasing the reward to bond holders due to higher inflation.
Chart 1: U.S. Yield Curve Comparisons
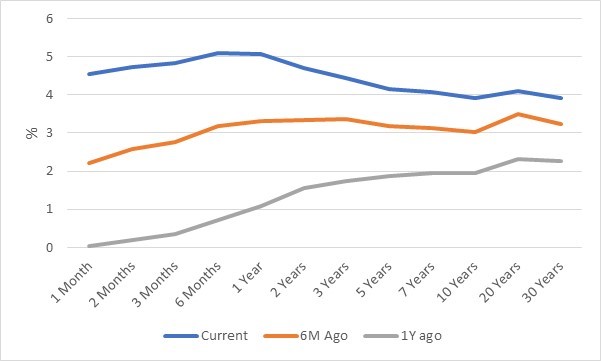
Source: Refinitiv Datastream, Credit Capital Advisory
While inflation appears to have peaked, other factors could place upward pressure on interest rates, including quantitative tightening as the Federal Reserve begins to shrink its $8 trillion balance sheet, as well as a decline in the savings rate. Furthermore, if new debt issuance rises substantially, increasing the overall stock of bonds, interest rates could rise further. Conversely, a fall in future nominal demand, a dramatic shift out of equities into bonds, or a fall in the marginal product of capital might cause interest rates to fall, alongside falling inflation.
So how can bond traders make sense of the future direction of interest rates?
Firstly, the outlook for profit growth remains negative, indicating that equities are less likely to experience sustained rising valuations as demonstrated in Table 1. The impact of lower expected profits will most likely result in a lower marginal product of capital and hence less demand for debt. Indeed, firms are reducing their leverage relative to investment as indicated by the corporate leverage ratio.
Table 1: Outlook for US Wicksellian Differential
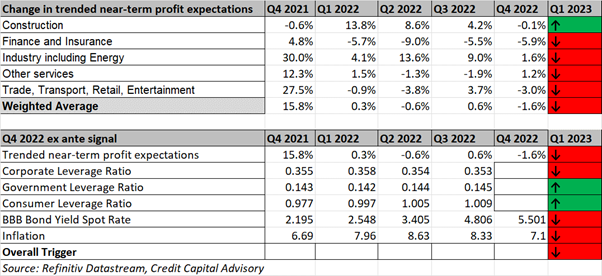
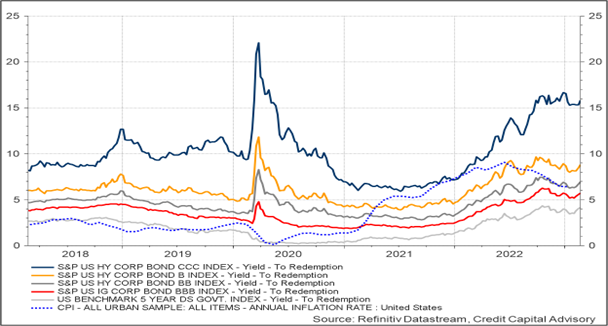
Consumers, however, continue to increase their leverage, sustained by a robust labour market, although falling house prices are likely to prevent this ratio from rising as it did in the early 2000s. One effect of buoyant consumers can be observed in the corporate credit market. Although the most risky bonds rated CCC continue to deteriorate, bonds rated single B and above continue to demonstrate resilience. Given that most corporate projects are not undertaken at the margin, which is why the marginal product of capital rarely equates to the money rate of interest, a rise in rates from around 5% to 8.8% for single B firms – while nominal demand remains robust – suggests these firms still have sufficient liquidity. Indeed, the weighted average return on capital for the U.S. economy in 2021 was 14.3% compared to the BBB cost of funding of just 3.3%. While the BBB cost of funding is now more like 5.7% and the return on capital is expected to fall – it has some way to go before we see the capital destruction that is normally associated with a recession.
Chart 2: US Bond Market Indicators
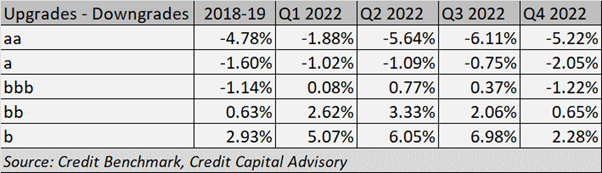
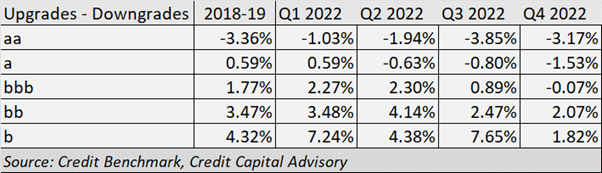
The resilience of single B bonds and above can also be observed in credit transition matrices for North American corporates. The Credit Benchmark data, based on over 40,000 observations of firms that banks have some form of credit exposure to, demonstrate that the relationship between upgrades and downgrades for single b obligors is now only slightly lower than during the period between 2018-19.
Table 2: Credit Transition Matrix – North America Corporates
While this is reasonably good news for corporates, the outlook for North American financials is more precarious. Here there is clear evidence of greater stress across all credit categories compared to the 2018-19 benchmark period, with single b names appearing increasingly unsustainable. The question for bond traders is to what extent continuing downgrades of non-bank financials across the shadow banking sector might result in a broader financial contagion.
Table 3: Credit Transition Matrix – North America Financials
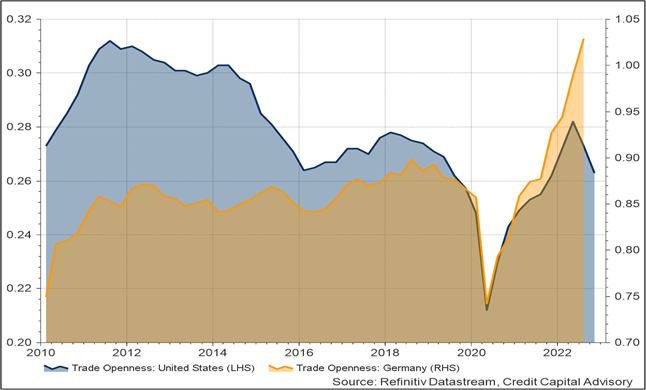
Perhaps more worryingly for bond traders though is the dawning realization that inflation is likely to be far stickier than previously expected. One major driver behind this stickiness is the increasing shift towards protectionism by President Biden, as warned here. Trade openness in the United States – which is already a reasonably closed economy — is declining compared to Germany, an open economy that is becoming more open as shown in Chart 3. A more open economy reduces the bargaining power of domestic labor which is why the Phillips Curve during the age of hyper-globalization has been flat.
Chart 3: Comparison of Trade Openness
If this protectionist trend continues, the Federal Reserve will have to keep raising its target rate to try and bring inflation down further, hence interest rates may well have further to rise before other factors start to drag them down again. For bond traders trying to get to grips with the conflicting signals, short term Treasuries will begin to look increasingly attractive given the yield – that is of course assuming the debt ceiling arguments are appropriately resolved.
Trackbacks/Pingbacks