The rate of profit growth appears to have stalled in the United States resulting in declining equity valuations. However, the extent of the cumulative credit process in this credit cycle implies a much lower level of asset correlation than in previous cycles.
The October market volatility took most investors by surprise, resulting in increasing uncertainty for equities. The update from the Federal Reserve on September 17th which saw “sufficient underlying strength in the economy to support ongoing improvement in the labor market” was positive enough to push the S&P 500 up 2 ½ points to close at over 2001. Since then a confluence of events appears to have shifted market expectations. Poor industrial production data from Germany, continued stagnation across the Eurozone, the potential of an ebola pandemic, and ongoing geo-political issues in Syria / Iraq, Hong Kong and Ukraine are increasing the levels of uncertainty, which is reflected in higher levels of market volatility. More recently the fall in oil prices has added to this uncertainty.
For investors using macroeconomic data such as GDP and inflation forecasts to make asset allocation decisions, the challenge remains in understanding to what extent these factors will hinder the growth in output and hence equity values. Such an approach, however, assumes that there is a positive correlation between GDP growth and rising equity values. Not only have numerous studies found little correlation between these two variables, but recent experience highlights that this approach to investing does not help investors preserve capital. On the cusp of the crisis in 2007, macroeconomic forecasts were strong, yet valuations fell off a cliff with the S&P 500 losing over half its value between October 2007 and March 2009.
In Profiting from Monetary Policy the argument was made that investors need to discard the framework of general equilibrium models and focus on a credit disequilibrium process. Thus what investors need to be concerned about is the difference between the return on capital and the cost of capital, known as the Wicksellian Differential. When the Wicksellian Differential is increasing, the outlook for equities is positive and when it is decreasing the outlook for equities is negative. Chart 1.0 shows the relationship since 2003 of the return on capital and cost of capital against US equities. For this chart the five year BBB cost of funding is used as opposed to the 5 year government yield.
Chart 1.0 US Natural rate of interest, BBB cost of funding, Total US equity market
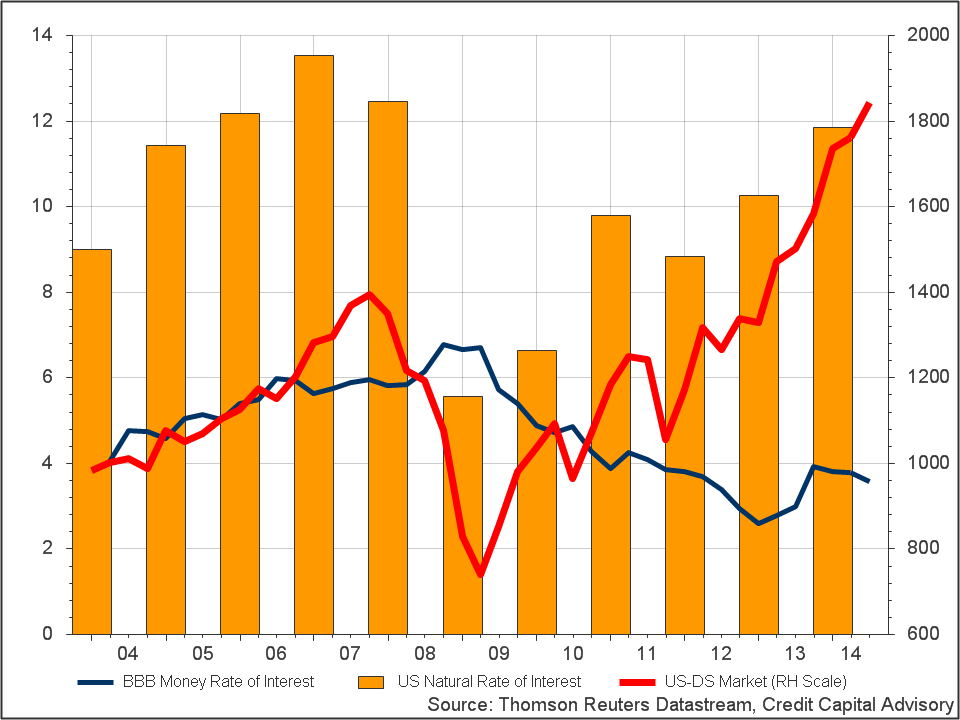
The data shows the return on capital or natural rate of interest rose faster than the cost of capital or money rate of interest between 2003 and 2006 in conjunction with rising equities. In 2007 and 2008 the return on capital fell, followed by the crash in equities. The Wicksellian Differential in 2008 was negative implying capital destruction, which exacerbated the down swing. The subsequent rise in the return on capital in 2009 – 2010 led to rising equities, with a dip in 2011 in tandem with a slight decline in equities. Since 2012 the return on capital has increased once more with equities reaching record highs.
Although this framework demonstrates a close relationship with the direction of equity valuations, the Wicksellian Differential is an ex-post indicator. Hence for this framework to be useful for investors, an ex-ante model is required to provide short term forecasts for the cost of capital and for the return on capital. Forecasts in excess of a year are unlikely to be of much value given the complexity of the economy and the ability of inputs to affect outputs in sometimes substantial ways. Credit Capital Advisory’s ex-ante model uses company earnings related data in conjunction with a number of macro indicators including interest rates, leverage ratios and productivity to explain the sources of profit. This report is now published quarterly for the United States, a month before earnings season.
The reasons for the rising Wicksellian Differential since 2009 have been diverse highlighting the constant need to update models as new data is published. For example one of the major drivers for the 2009 to 2010 bounce was the dramatic rise in productivity growth. Firms shed employees quickly and relied on the existing labour force to take up the slack. The Fed’s QE programmes have also supported the growth in equity values, although perhaps not in the way that was anticipated nor intended. As can be seen from chart 1, the BBB cost of funding fell from 6.7% to 3.6% between March 2009 and June 2014. Although there are numerous factors at work here, it appears that QE has had some impact in bringing down corporate bond yields. However, this did not lead to a significant rise in investment that the Fed was hoping for. The expectations of rising returns on capital, not low interest rates, are the main driver of investment. Falling yields also drove down the dollar, thereby boosting exports for US firms. However a major driver of profit growth was the fall in corporate bond yields which triggered a massive refinancing programme for corporations.
According to a McKinsey study, the decline in interest rates lowered US companies’ 2012 net interest expenses by $94 billion compared with 2007. Additionally taking into account changes in balance sheets, this amounts to a cumulative benefit of $310 billion since 2007. This increased corporate profits by 5 percent in 2012 and accounted for just over 20 percent of the growth in their profits since 2007.
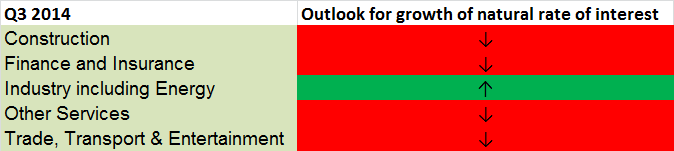
Three quarters of the way into 2014, the benefits of QE on profits are coming to an end. Moreover, consumers remain cautious about leveraging themselves up to increase consumption and productivity growth has not jumped sufficiently to act as the next driver for rising equity values. Hence it should not have been surprising that the Credit Capital Advisory outlook for the rate of growth in profits began to decline in the run up to Q3 earnings with the exception of the industrials and energy sector which remained reasonably robust.
Table 1: Q3 2014 ex ante natural rate of interest indicator
To date, Q3 2014 earnings have been mixed which provides further evidence that the rate of growth in profits has stalled, halting the rise in equity valuations. However, one should not assume that this will lead to another crash in equity values along the lines of the dot com crash or the Financial Crisis.
An analysis of the three Wicksellian cumulative processes since the early 1990s recession, demonstrates this credit cycle has generated far less excess credit than in both the credit boom prior to the Financial Crisis and the dot com era. The Credit Capital Advisory Cumulative Credit Index is currently at 107. The index reached 118 before the dot com crash and 128 before the financial crisis. Our empirical analysis shows that the lower the value of this index, the lower the correlation of assets and the lower the default rate. Moreover, the lower level of asset correlation suggests that there may be opportunities in other stock markets which have a rising Wicksellian Differential to generate superior returns. A credit disequilibrium approach to investing helps preserve capital as the credit cycle shifts, something that traditional general equilibrium approaches to asset allocation have generally failed to do.
Trackbacks/Pingbacks