The current market debate on interest rates has tended to focus only on the money rate of interest, and hence on when the Federal Reserve might start to cut short term rates. The idea is that a cut in rates will make money cheaper and therefore boost equities. Over the last three months, although the five year government benchmark has remained pretty stable, shifting from 4.4% to 4.3%, the five year BBB rate has fallen from 6.2% to 5.7%. This is part of the reason why US equities have outperformed, with the Nasdaq composite index returning 12% in the last quarter.
But investors should also take note of the other rate of interest as described by Knut Wicksell in his seminal 1898 book Interest and Prices, which he called the natural rate. The natural rate should be understood as the return on capital assets. In economic theory these two rates should come into equilibrium with loans being extended until the marginal return on capital equals the money rate. But this is not what happens in the real world. When the natural rate increases, indicating higher levels of future returns, this should drive equity valuations higher.
Last quarter’s note indicated that the return on capital for larger services firms was expected to increase, and hence has also played a role in driving equity valuations higher. This is why investors need to take note of both rates of interest to ascertain where an economy is in the credit cycle, and hence allocate assets appropriately.
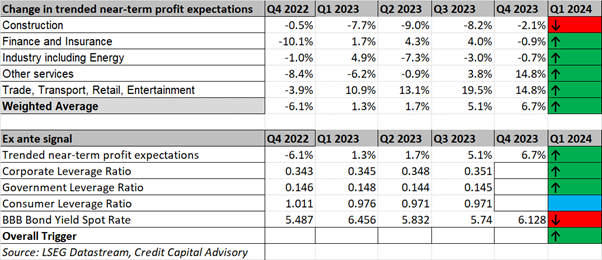
The latest ex-ante Credit Capital Advisory signal for the US credit cycle indicates continued strong performance of the expected return on capital for the two major services sectors as indicated in Table 1. The construction sector is still experiencing declines in the rate of growth while financial services and industry including energy are yet to see positive growth – although the rates of growth are stabilizing. In addition to the positive near-term trended profit expectations, there are three pieces of evidence that back up this growth story.
Table 1: Outlook for US Wicksellian Differential
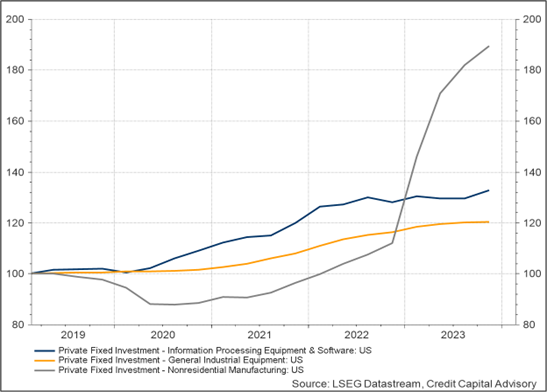
First is the fact that corporations buoyed by future expected profits are continuing to increase their leverage for investment, which is an indication of higher future expected demand. While this has been clear for information processing, given the revolution in artificial intelligence, it is also happening across manufacturing plant and general industrial equipment as indicated in Chart 1.
Chart 1: US Corporate Investment Indicators
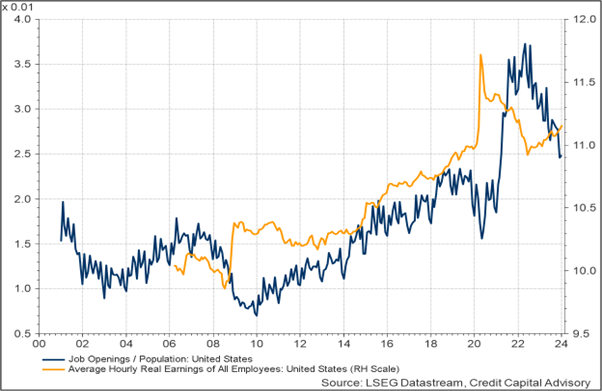
Second is the ongoing strength of the US labour market combined with the fact that consumers are not overleveraged. Although job openings continue to fall from their previous highs, they remain strong historically – even when controlled for the growth in the US population. In addition, average real earnings continue to rise which also supports the ability of consumers to meet higher levels of debt payments. And crucially these higher levels of payments are of greater importance for higher income households.
Chart 2: US Labour market indicators
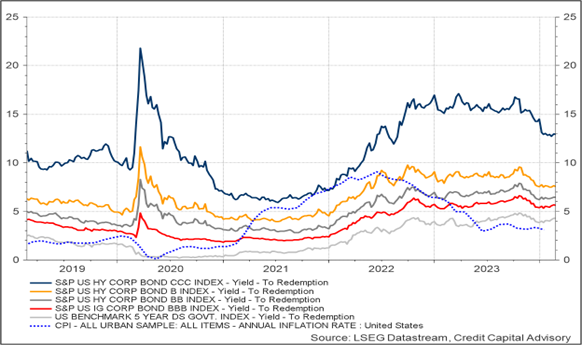
Third is that the bond market continues to indicate that indebted firms are currently able to meet their obligations, with single B rated bonds still not experiencing any decoupling from higher-rated bonds. And even the CCC index has seen some improvement.
Chart 3: US Bond market indicators
While the evidence indicates the return on capital is expected to continue to rise, the assumption that five year BBB rates will fall if the Federal Reserve cuts short term rates is somewhat problematic. The bond market has entered into a new regime where inflation is more likely to oscillate between a 2.5 to 3% range based on sustained growth in nominal income, a robust jobs market and its impact on services inflation, alongside the continued fall in trade openness of the US economy. This means that short term yields are unlikely to fall below 4% with five year yields pricing a little higher than they are now. Crucially, there is not a lot of evidence that just because short term rates fall, so should long term rates – particularly given the ongoing inversion of the curve. However what matters for corporates is the BBB five year rate. It is here that the market may have become somewhat over optimistic.
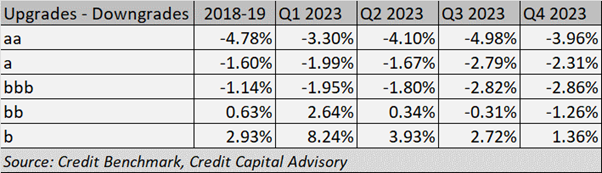
The most recent credit transition data for North American corporates from Credit Benchmark based on over 40,000 observations indicates accelerating credit deterioration for bb names and with fewer upgrades for single b names. This suggest that credit spreads are likely to widen which may well drag BBB spreads wider, thereby driving up the cost of capital for firms.
Table 2: Credit Transition Matrix – North America Corporates
As long as the bond market continues to ignore this emerging deterioration in the credit outlook, the outlook for equity valuations seems reasonably positive. However, once the bond market wakes up to reality, the Wicksellian Differential may start to decline, placing downward pressure on equity valuations.
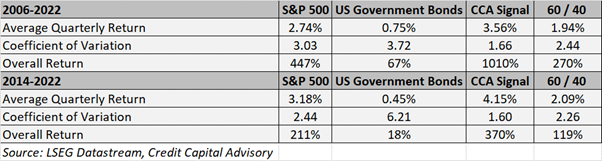
By focussing on both rates of interest across the credit cycle, investors can allocate assets to equities as the Wicksellian Differential increases and to government bonds as it decreases. Since the publication of these regular notes in 2014, this strategy has generated equity-like returns with bond-like volatility, continuing the outperformance since the strategy started in 2006. While over time the measurement of the credit cycle has improved, providing greater flexibility for investors, the strategy remains fundamentally rooted in Wicksell’s theoretical approach based on two rates of interest. It’s not just about the Fed!
Table 3: Comparison of Returns Data
Trackbacks/Pingbacks