Federal Reserve Chair Jerome Powell throughout 2023 has been hawkish on inflation and the need to increase and maintain higher levels of interest rates. The market reaction during the first half of 2023 was that this would trigger a recession, given the view that higher interest rates are not sustainable and will result in an increase in defaults and a subsequent fall in interest rates.
This narrative of lower future interest rate levels appears to have been influenced by recency bias and the idea that interest rates need to return to lower levels in order to sustain the economy. This market narrative has, however, been fundamentally wrong as my notes from February and May indicated.
Investors who believed in the narrative and invested in long maturity US Treasuries have been hit by capital losses which negated any increase in yield. The total return on the 10 year US Treasury year to date has been around -1%, while investors in 6 month Treasuries have seen a 4% increase. Investors in the S&P 500 would have returned 15%, although this outperformance has mostly been driven by just five stocks including Apple, Microsoft, Amazon, Alphabet and Nvidia.
One investment approach, to avoid following misleading market narratives, is to use credit cycle signals as I set out in my 2012 book, Profiting from Monetary Policy. Credit cycle signals since February this year have been indicating that the future trajectory of long term bond yields was up and the most recent data indicates that this is unlikely to reverse in the short term, for two main reasons.
First, near-term trended profit expectations are up for the US economy. This has been driven by services while construction and industry including energy are starting to see negative outlooks. Despite this positive outlook for parts of the economy, the slight fall in both consumer and firm-level leverage indicates that future demand is not expected to increase. And although the cost of funding for BBB firms has risen dramatically since last year, it has fallen in the last quarter. So while the projected US Wicksellian Differential (defined as the return on capital minus the cost of capital) is declining, the data indicates that this decline is not significant, particularly given the ongoing robust labour market data.
Table 1: Outlook for US Wicksellian Differential
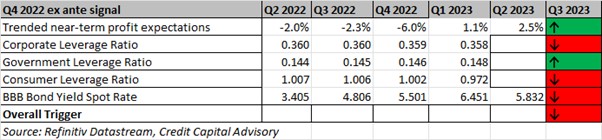
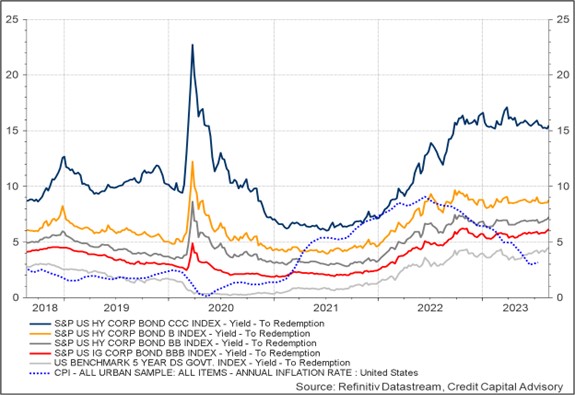
Second, credit spreads continue to demonstrate stability for B bonds and above indicating that credit risk is not currently of great concern for investors at the moment.
Chart 1: US Bond Market Indicators
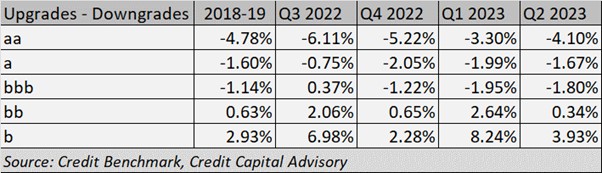
The stability of credit spreads is backed up by the latest credit transition matrix (CTM) from Credit Benchmark for North American corporates based on over 40,000 observations by banks with actual exposure to companies. The CTM indicates that credit risk across North American corporates is akin to the period 2018-19 which was not a period of significant defaults. There is, however, one significant difference between the two periods in that the credit quality of investment grade firms is lower than during the 2018-19 period. An increasing portion of the portfolio at lower investment grade, though, is not going to drive up default rates in the short term.
Table 2: Credit Transition Matrix – North America Corporates
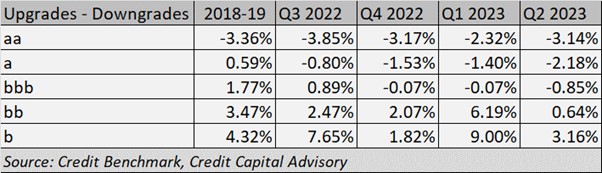
There are, however, signs of heightened deterioration in the North American Financials CTM – driven by the rise in interest rates. The data demonstrate that there has been a significant deterioration for single a and bbb names, with fewer upgrades for bb and b names compared to the 2018–19 period. This should be a concern for investors, although the challenge remains to understand how defaults across the shadow banking sector might impact the real economy.
Table 3: Credit Transition Matrix – North America Financials
Although there are clearly risks across the US financial sector due to higher interest rates, just because long maturity bond yields are up (nominal and real), it doesn’t mean that the economy is going to grind to a halt. Indeed, there is not much evidence that reducing the cost of capital has much impact on a firm’s willingness to invest. What matters is future demand – which tends to improve when interest rates are rising.
In 2022, the return on capital for the US economy was 12.8% compared to a BBB funding rate of 5.1%. Given that many projects that came to fruition in 2022 were funded in previous years, the cost of capital is potentially even lower. A worst case scenario indicates a Wicksellian Differential of 7.7% which absolutely does not indicate tight money. A Wicksellian Differential below 1% is indicative of excessive tightening and capital destruction as was the case during 2008.
Although the cost of funding in the US has risen and the return on capital is unlikely to increase, the projected 2023 levels are still likely to generate a significant positive number, albeit less than 7.7%. For comparison purposes the situation in the eurozone is much more precarious with a Wicksellian Differential averaging 2.8% – nearly 5 percentage points lower. (Due to the lack of data on BBB funding rates by country, a 2% premium was added to the 5 year European benchmark based on historical US data)
Chart 2: Comparison of Wicksellian Differential by Country 2022
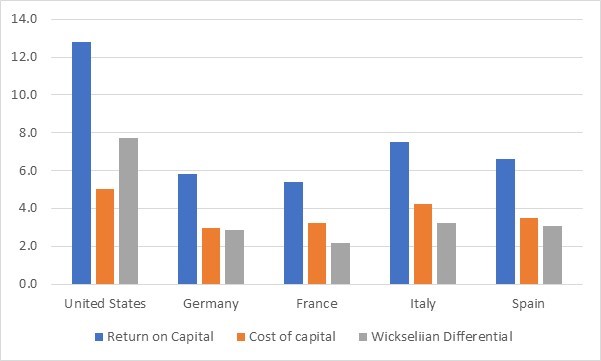
Source: Refinitiv Datastream, Credit Capital Advisory
If we assume that the return on capital remains where it is (which is less likely given the European outlook) the best case scenario for the Wicksellian Differential for eurozone countries is around 1% indicating monetary policy is too tight, resulting in a period of capital destruction.
Chart 3: Projected Wicksellian Differentials for 2023
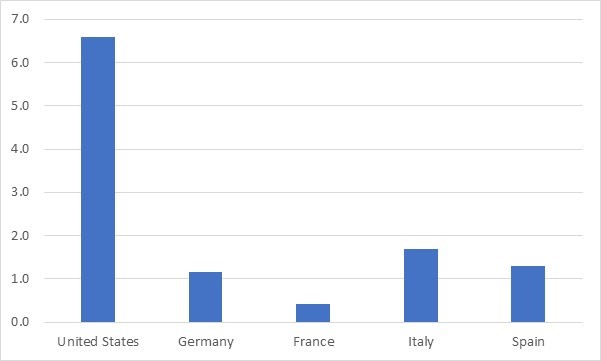
Source: LSEG Datastream, Credit Capital Advisory
Although the US economy remains robust in the short term, the headwinds from the eurozone and China may have some impact. The US economy, however, remains far less exposed to such international pressures given its relatively closed nature combined with the low levels of unemployment, fiscal stimulus and an increasing drift towards protectionism.
Should output deteriorate suddenly with a dramatic increase in unemployment, investors ought to ignore the post Global Financial Crisis interest rate environment when thinking about the future relationship between short and long term rates. Chart 4 shows the changing shape of the US yield curve including after the dot com crash which might be understood as a worst case scenario with very aggressive falls in short terms rates to counteract a significant slump in demand. The 30 year rates fell from 5.7 to 5.1% suggesting that even in a worst case scenario, long term rates are unlikely to fall by much.
Chart 4: US Yield Curve Comparisons
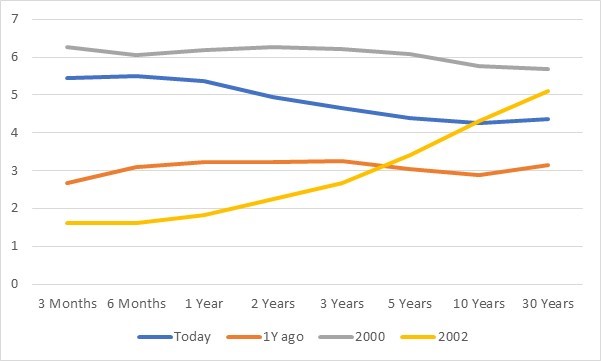
Source: Refinitiv Datastream, Credit Capital Advisory
On balance, the data indicates that the US economy in the short term will continue to outperform the negative market narrative. Despite this relative robustness, a declining Wicksellian Differential tends to coincide with falling capital values – particularly given that larger US firms have some exposure to Europe and China – alongside credit deterioration in US financials. Despite this concern, there are few indications that long maturity Treasuries are about to fall. And in the event of a significant downturn, the upside is unlikely to be as significant as during the post-GFC period. The current position of the credit cycle therefore indicates a continued focus on short maturity Treasuries.
Trackbacks/Pingbacks