US market expected to maintain growth in capital values despite negative outlook for equities in other markets
2013 Model Predictions vs Actuals
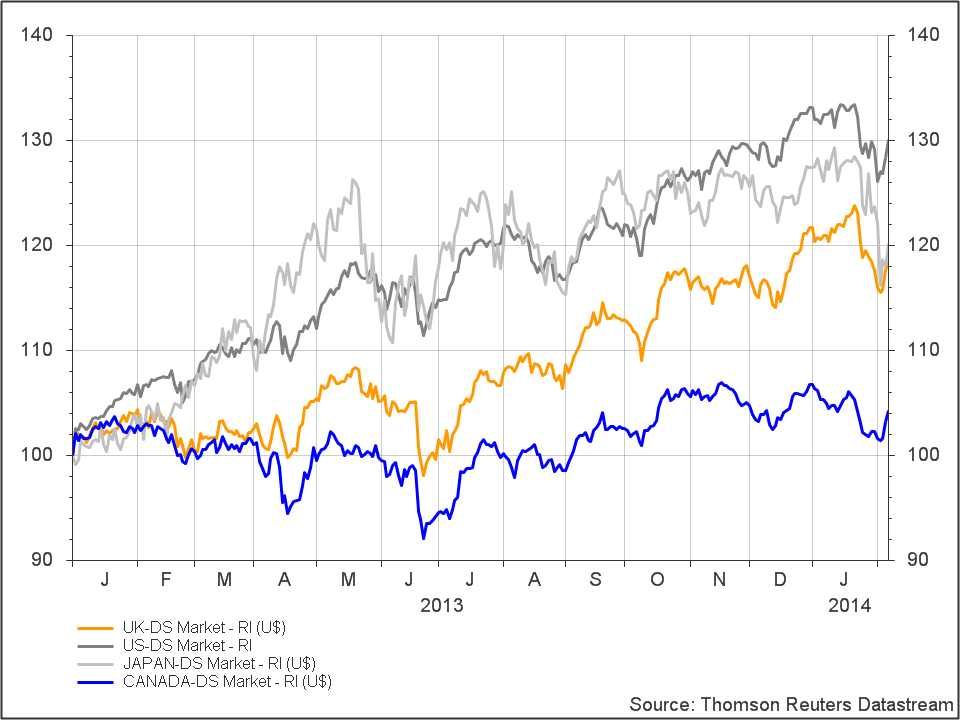
Credit disequilibrium asset allocation modelling proved to be extremely effective in forecasting asset value trajectories in 2013. The model prioritised the US equity market as having a positive outlook, whilst raising some concerns about the UK market due its poorly performing financial services sector. Although the outlook for Japan and Canada was positive, the lower absolute level of returns on capital in Japan and the high levels of consumer leverage in Canada also remained concerns. These expectations roughly played in actual stock market returns as shown in chart 1 with the US turning in an outstanding performance with the UK market picking up in the latter half of 2013. Japan’s stock market which performed on par with the UK was largely driven by its close correlation to the falling yen, from which it has still not been able to decouple. Finally Canada performed less well, although this was largely driven by its exposure to commodity related stocks. So what’s the prognosis for 2014?
Chart 1: Total return indices: Canada, Japan, United Kingdom & United States
2014 outlook for major equity markets
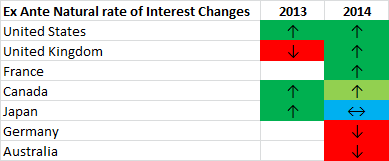
The ex-ante signals on the neo-Wicksellian model are once again indicating positive growth in capital values for the United States – despite the incredible bull-run since 2009. Most sectors are still expecting increased profit growth with the exception of the construction sector. Concerns remain with regards to the money rate of interest rising above 2% which may lead to a falling Wicksellian Differential. Given these concerns, the signal on the US market will now be updated every quarter to help mitigate shifts in expectations during the year.
The picture for the United Kingdom is more positive this year mainly due to the belated rise of profitability in the financial services sector. However the broader services sector remains weak in terms of profit growth, partially due to poor productivity growth. Rising corporate and consumer leverage ratios provide further impetus to the positive signal.
The growth in profit expectations for Japan remains weak for 2014 across most sectors of the economy. However recent improvements in productivity growth in conjunction with a rise in corporate leverage have offset some of these negative factors generating a neutral signal.
The outlook for Germany is similar to that of Japan with weak profit expectations across nearly all sectors. However a falling consumer leverage ratio and a static corporate leverage ratio have contributed to the generation of a weak negative signal. In contrast, expectations for profit growth in France are positive across most sectors with rising consumer and corporate leverage ratios generating a positive signal.
The Canadian economy is still maintaining a positive outlook. However falling profit expectations now exist in several sectors including financial services and construction, in conjunction with a falling corporate leverage ratio. Higher productivity growth and continued rising consumer leverage have countered this negative outlook somewhat leading to a weak positive signal. Finally, the outlook for Australia has begun to turn negative with falling consumer and corporate leverage ratios as well as rising inflation. This negative outlook has been tempered to a degree with robust productivity growth thus generating a weak negative signal
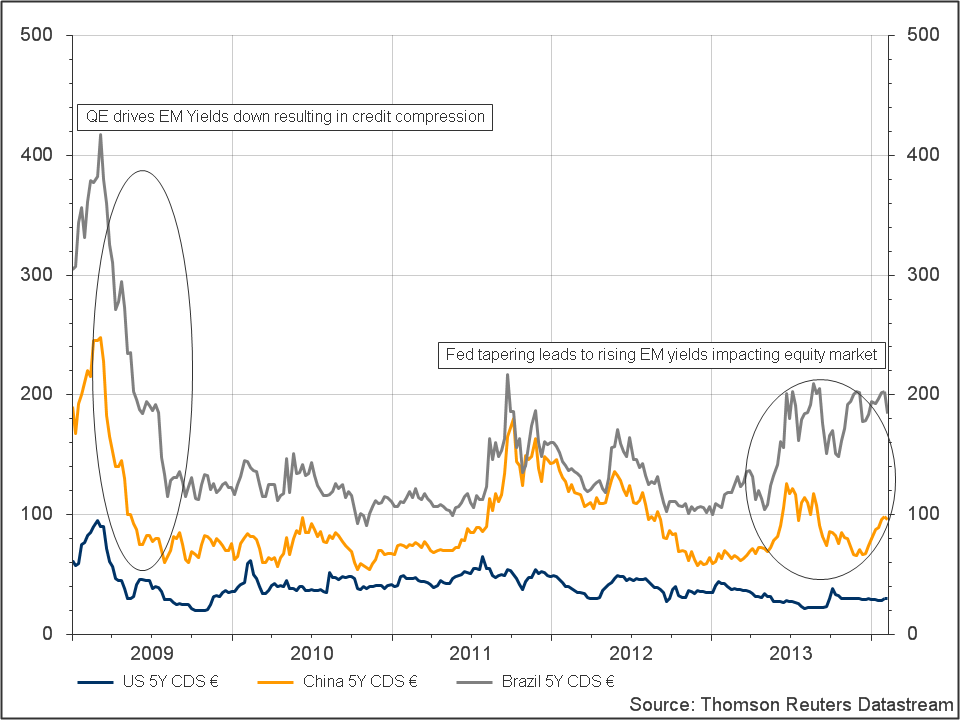
Finally, emerging markets can expect to remain volatile as Fed tapering unwinds. In 2009 as the Fed embarked upon QE, falling yields on US Treasuries led investors to move into emerging markets driving credit compression leading to an unsustainable fall in the cost of funding as shown in chart 2. As this reverses and emerging markets yields rise, it will negatively impact emerging market equities due to the rise in the cost of funding. However, those equity markets with a negative outlook are still likely to benefit from the growth in the US market due to the correlation effect of global equity values as the US comprises around 25% of global market capitalisation.
Chart 2: US, China and Brazil 5Y CDS